TFRD Dataset
TFRD dataset is generated using the data genereator based on FEniCS, and you can download at BaiduPan(Password: tfrd)。
TFRD dataset describes the heat source system with $0.1m \times 0.1m$ square board, where the heat source system is discreted as $200 \times 200$ grid. It consists of the HSink, the ADlet, and the DSine sub-data. Each sub-data includes 10000 training samples, 20000 testing samples (Test 0 represents the randomly generated samples, and Test 1, 2, 3, 4, 5 describes special samples):
Generality
Three typical heat source systems(HSink,ADlet,DSine)
Reasonability
The composition of TFRD is reasonable(includes 10000 training samples, 20000 testing samples divided into six different special samples)
- Diversity
Provide diversified boundary conditions, components as well as evaluation metrics
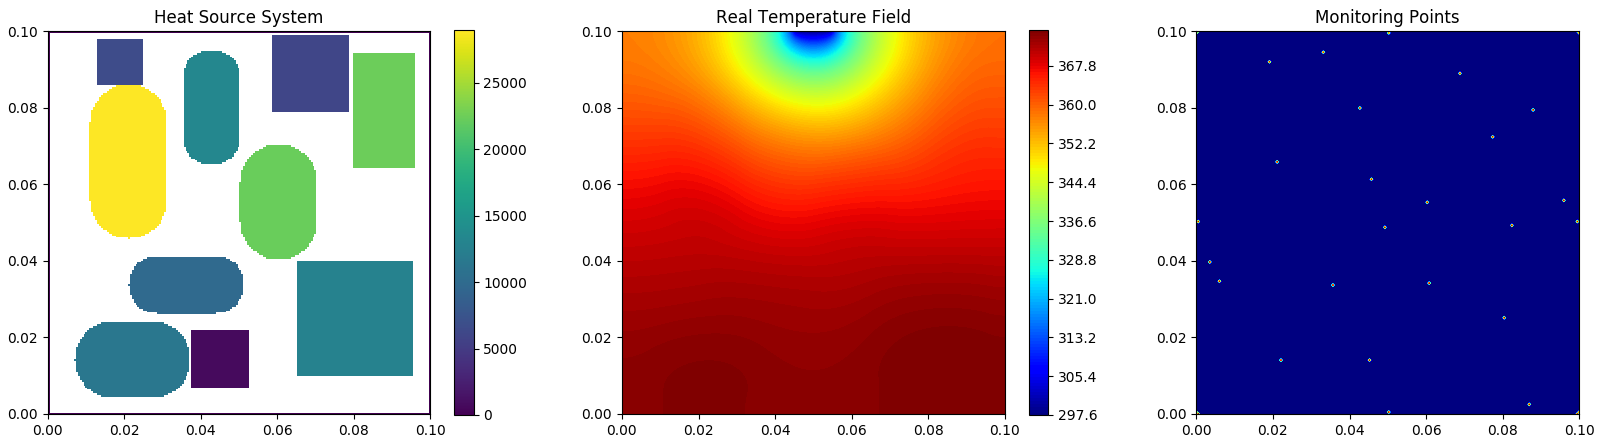
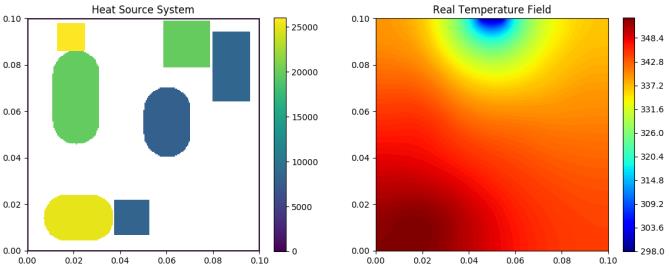
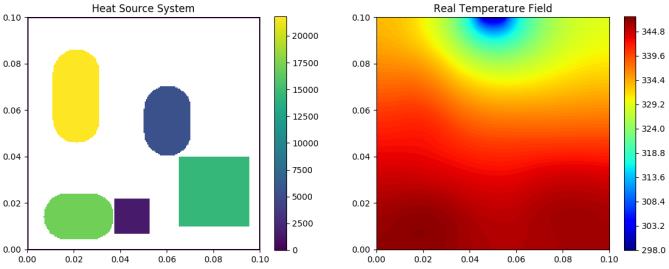
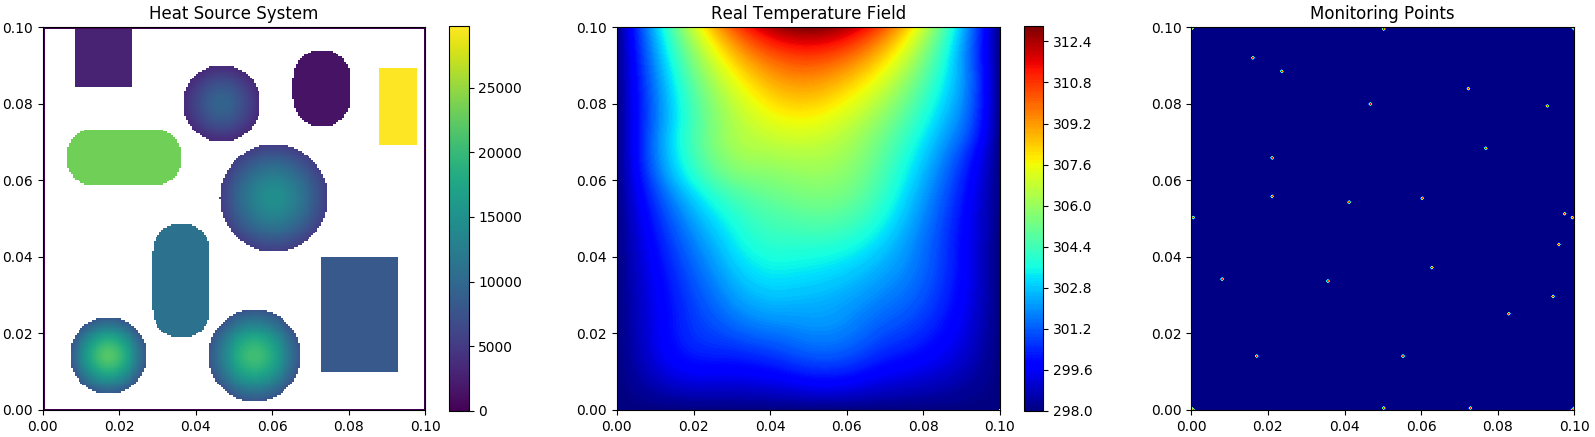
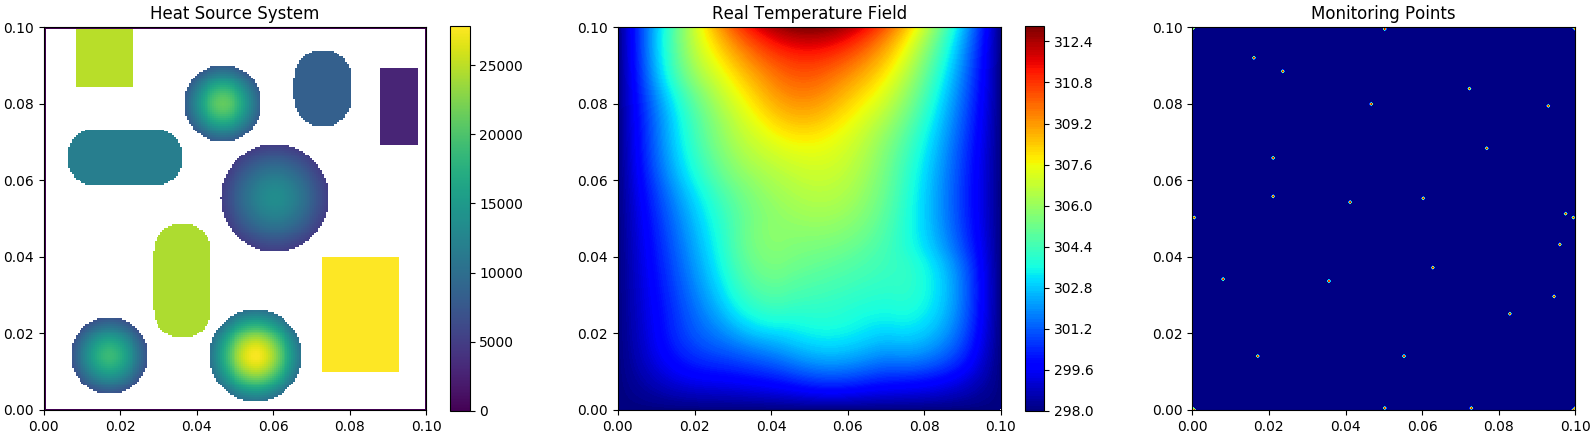
HSink Sub-data
Heat-source systems with heat sink for heat dissipation where the width is set to 0.01m with a constant temperature valued 298K (Dirichlet boundary).
 |
 |
|---|---|
| Training Sample | Training Sample |
 |
 |
 |
|---|---|---|
| Test 0 | Test 1 | Test 2 |
 |
 |
 |
| Test 3 | Test 4 | Test 5 |
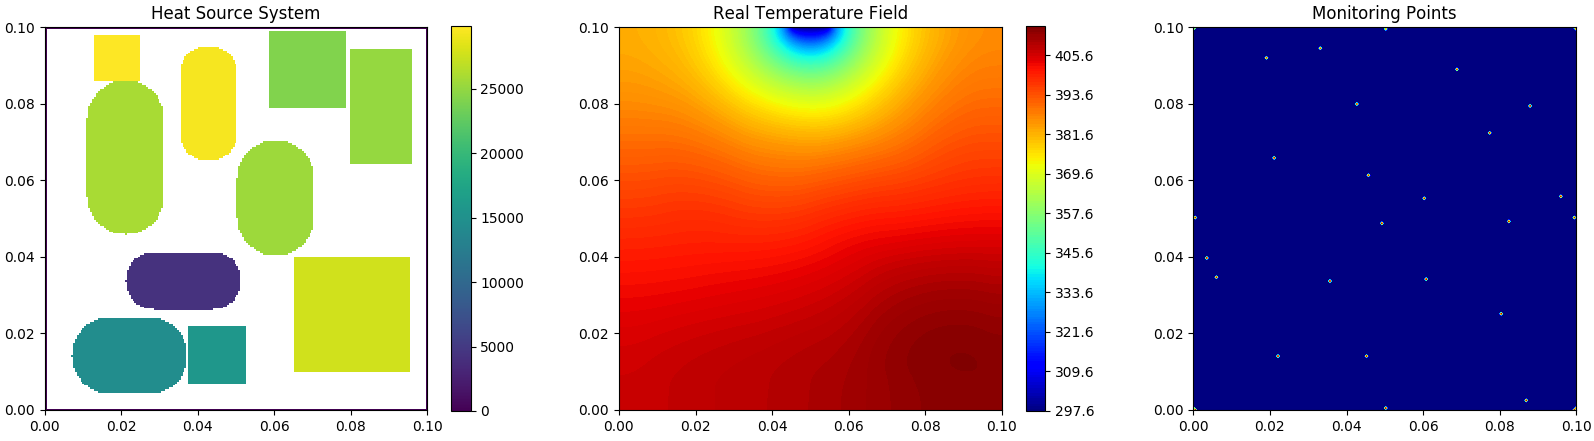
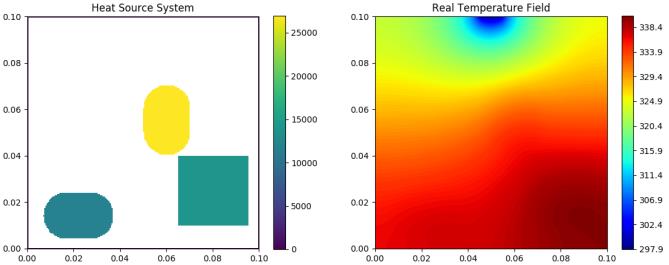
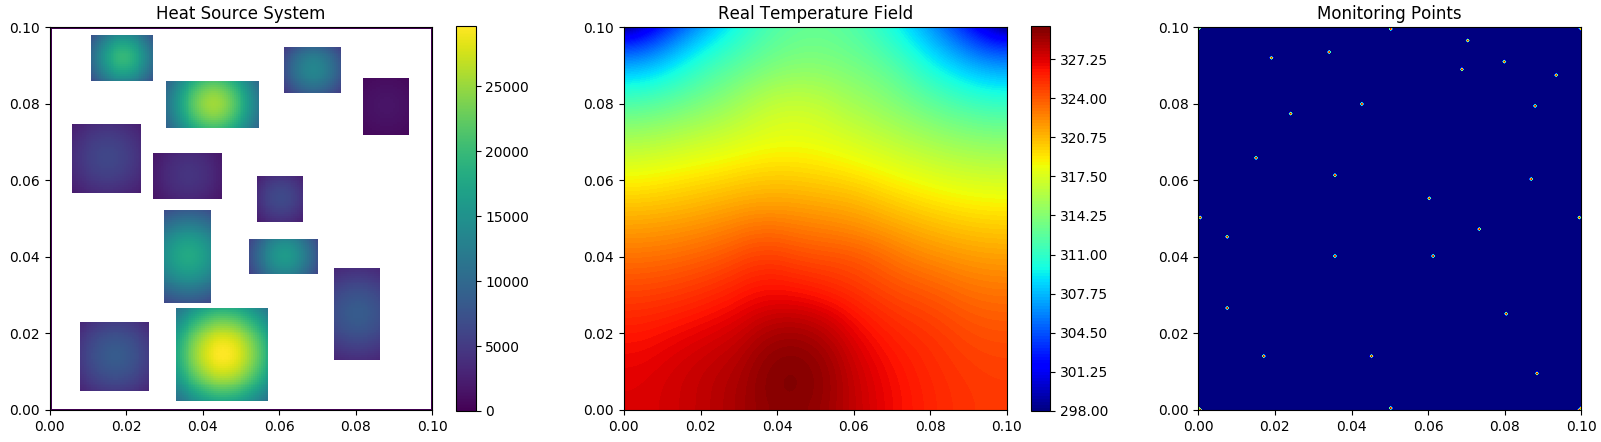
ADlet Sub-data
Heat-source systems with all different Dirichlet boundary conditions for heat dissipation where one boundary is set to sine-wave distribution and the others are set to constant temperature valued 298K.
 |
 |
|---|---|
| Training Sample | Training Sample |
|
|
|
|---|---|---|
| Test 0 | Test 1 | Test 2 |
|
|
|
| Test 3 | Test 4 | Test 5 |
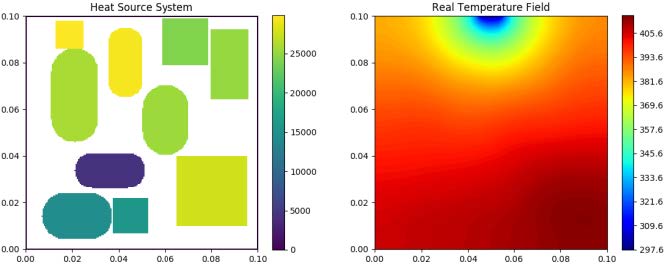
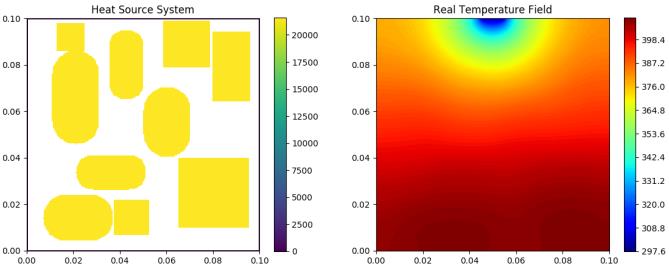
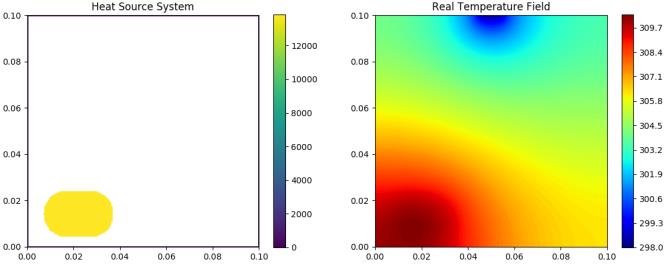
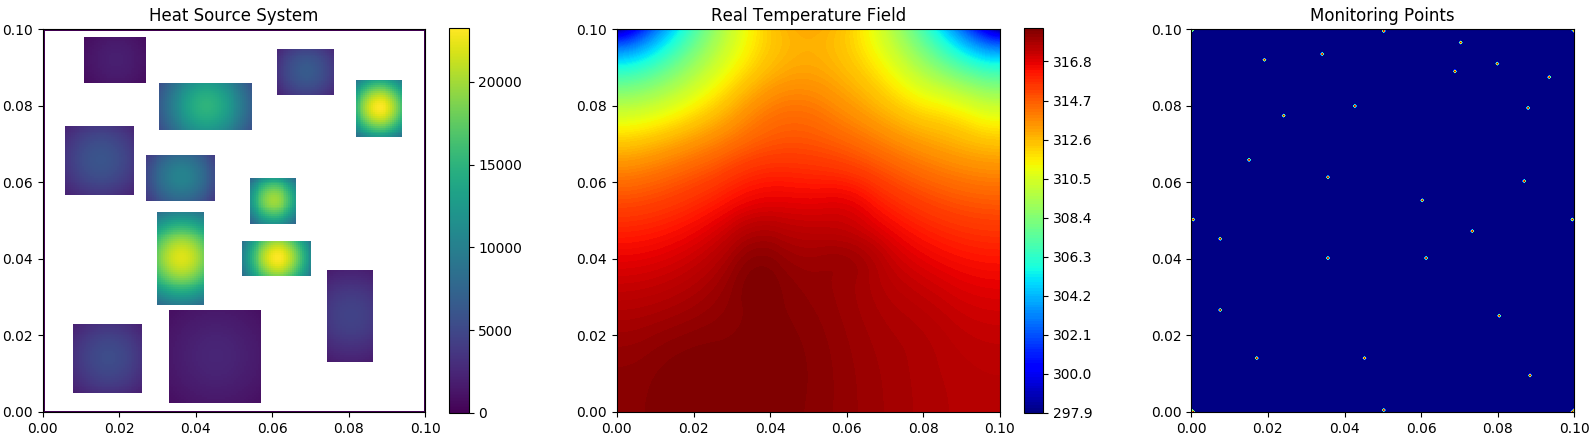
DSine Sub-data
Heat source systems with one sine-wave distributed boundaries for dissipation. All the other three boundaries are adiabatic (Neumann BC).
 |
 |
|---|---|
| Training Sample | Training Sample |
|
|
|
|---|---|---|
| Test 0 | Test 1 | Test 2 |
|
|
|
| Test 3 | Test 4 | Test 5 |
Data Description
The sample is saved as mat format.
- 'u':{ndarray:200,200},temperature information,ranging from 298-
- 'F':{ndarray:200,200},component information of the system,ranging from 0 to 30000
- 'u_obs':{ndarray: 200 , 200 },temperature information of monitoring information,ranging from 298-
- 'u_pos':{ndarray: 200 , 200 },position information of monitoring inforation,selected from {0, 1},1 describes the monitoring points and 0 represents other area without monitoring points
- 'xs','ys','zs':{ndarray: 200 , 200 },x, y, z coordinates information,ranging from 0 to 0.1
Evaluation Metrics
mean absolute error(MAE)
Mean absolute error(MAE)measures the mean value of absolute error of the predicted temperature field.
Maximum of absolute error(MaxAE)
Maximum of absolute error(MaxAE)measures the maximum of absolute error of the predicted temperature field.
Component-constrained mean absolute error(CMAE)
Component-constrained mean absolute error(CMAE)computes the mean value of the absolute error over the heat-source component.
Maximum of component-constrained absolute error(M-CAE)
Maximum of component-constrained absolute error(M-CAE)describes the maximum error of the predicted temperature field over the heat-source components.
Boundary-constrained mean absolute error(BMAE)
Boundary-constrained mean absolute error(BMAE)computes the mean value of the absolute error near the boundaries of the heat-source systems.