HSLD Dataset
HSLD dataset is generated using data generator based on FEniCS.
TFRD dataset describes the heat source system with $0.1m\times 0.1m$ square board, where the heat source system is discreted as $200\times 200$ grid. It consists of Case 1, Case 2 and Case 3 sub-data. Each sub-data includes 2000 training samples generated by Sequence sampling, 40000 testing samples where Test 1 and 2 is generated by Sequence sampling and Gibbs sampling separately, and Test 3, 4, 5, 6, 7, 8, 9 are special testing samples.
- Generality
Three typical heat transfer problems
- Case 1: volume-to-boundary (VB) problem under Dirichlet boundary conditions
- Case 2:volume-to-boundary (VB) problem under boundary conditions joint the Dirichlet and Reumann boundary conditions
- Case 3:volume-to-point (VP) problem under boundary conditions joint the Dirichlet and Reumann boundary conditions
- Reasonability
The composition of HSLD is reasonable(includes 2000 training samples, 40000 testing samples divided into 9 different special samples)
- Diversity
Provide diversified boundary conditions, components as well as evaluation metrics
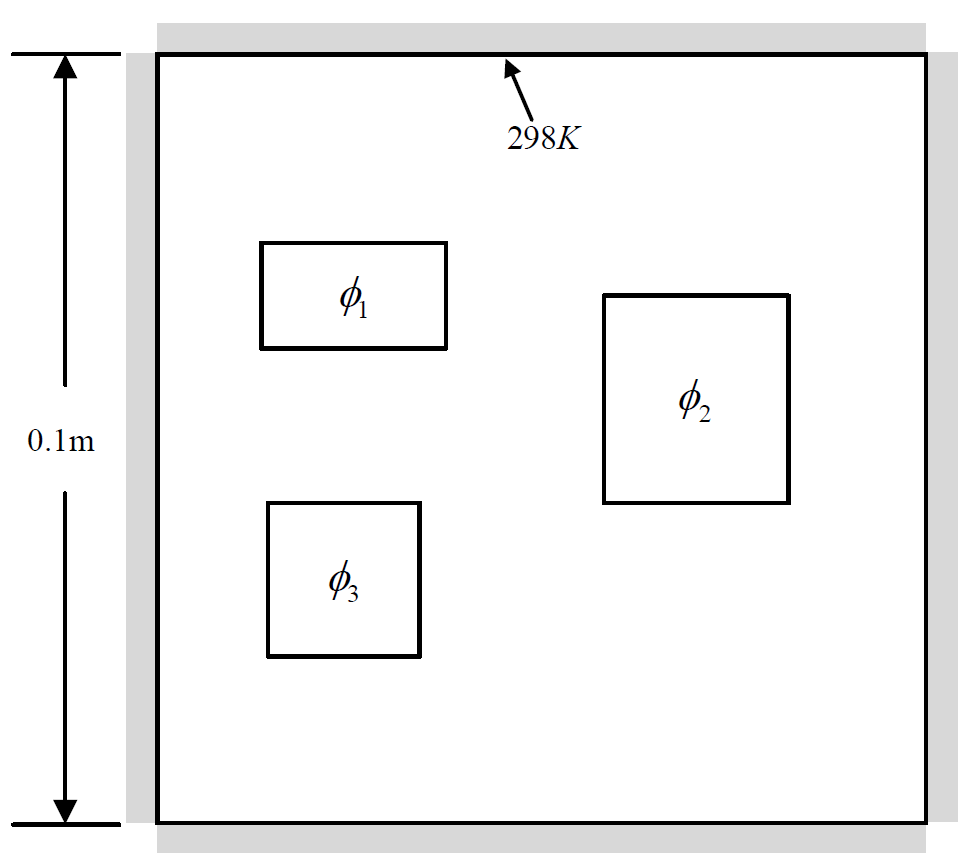
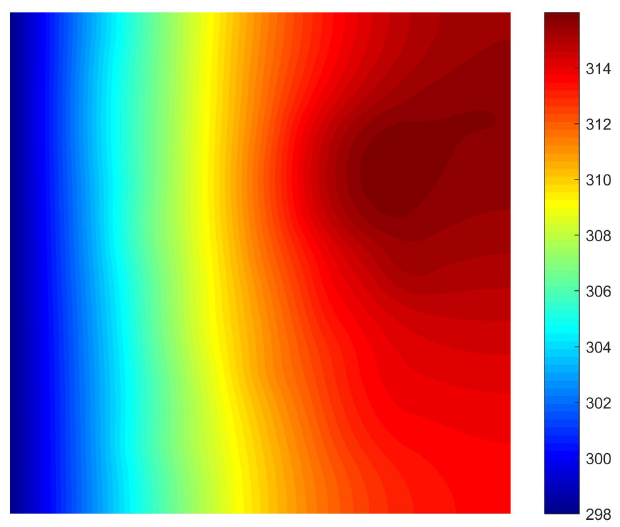
Case 1 sub-data
Heat-source systems with all Dirichlet boundary conditions for heat dissipation where the temperature values of all the boundarys are set to constant temperature valued 298K.
 |
 |
 |
|---|---|---|
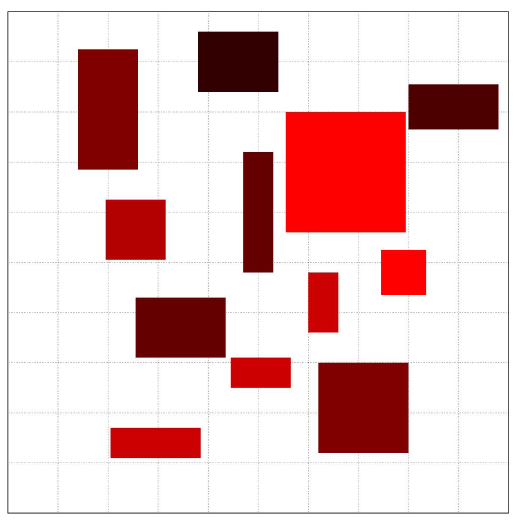
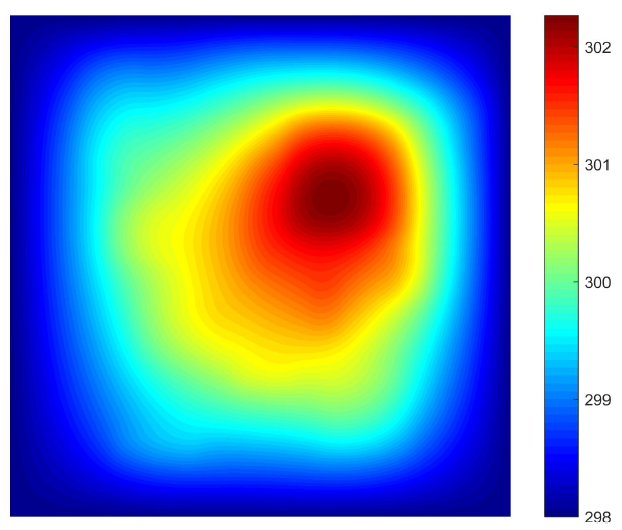
| Boundary conditions | Layout information | Temperature field |
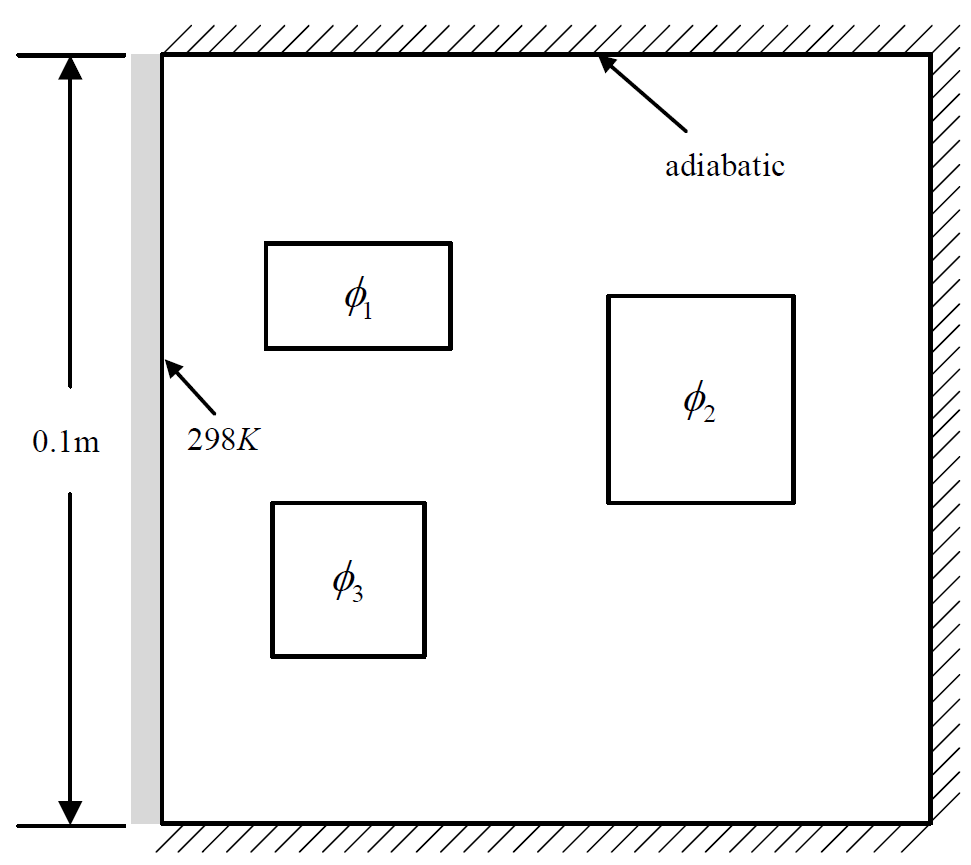
Case 2 sub-data
Heat source systems with one constant valued boundaries (298K) for dissipation. All the other three boundaries are adiabatic (Neumann BC).
 |
|
 |
|---|---|---|
| Boundary conditions | Layout information | Temperature field |
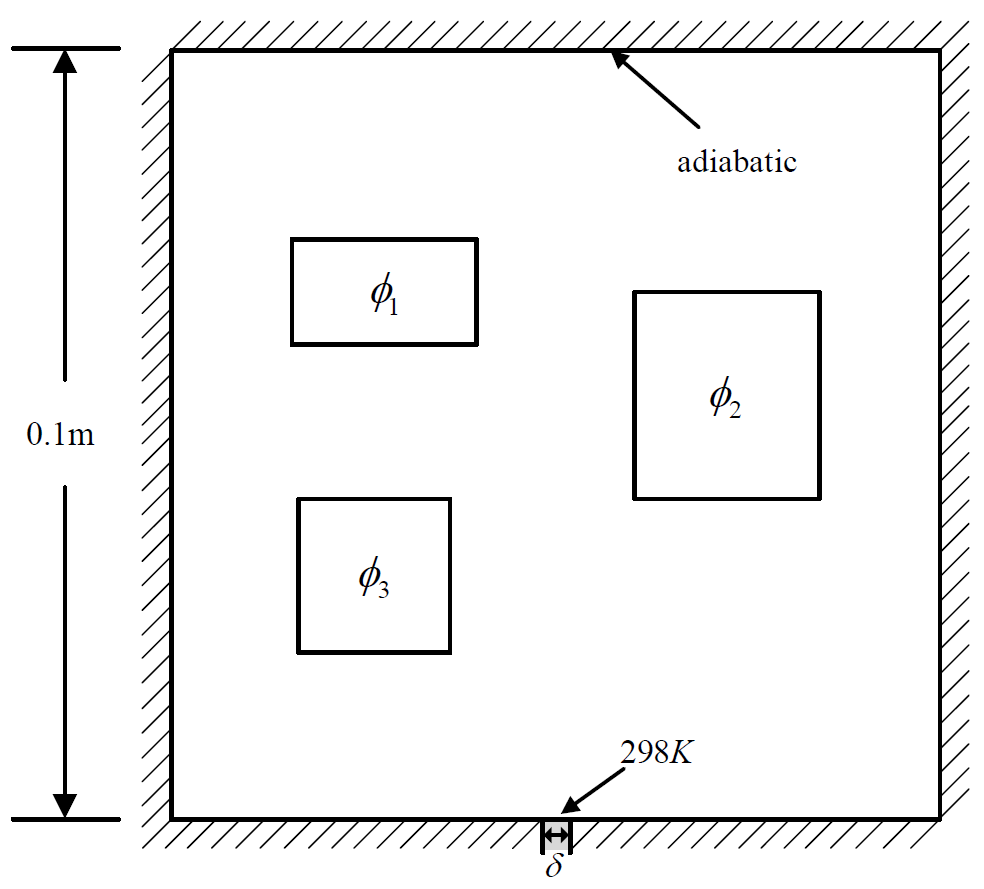
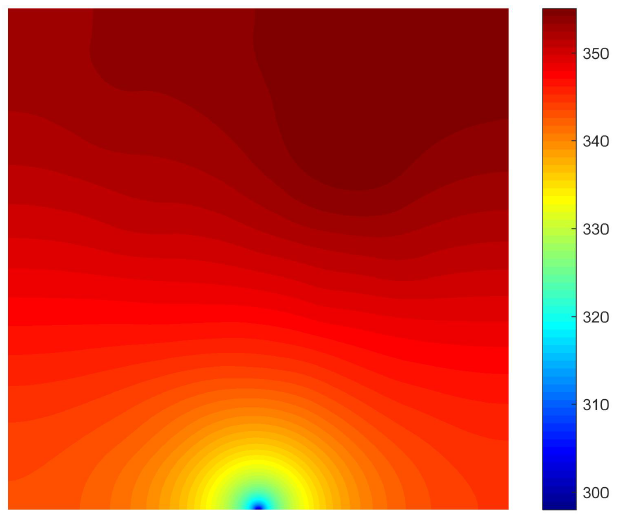
Case 3 sub-data
Heat-source systems with heat sink for heat dissipation where the width is set to 0.001m with a constant temperature valued 298K (Dirichlet boundary).
 |
|
 |
|---|---|---|
| Boundary conditions | Layout information | Temperature field |
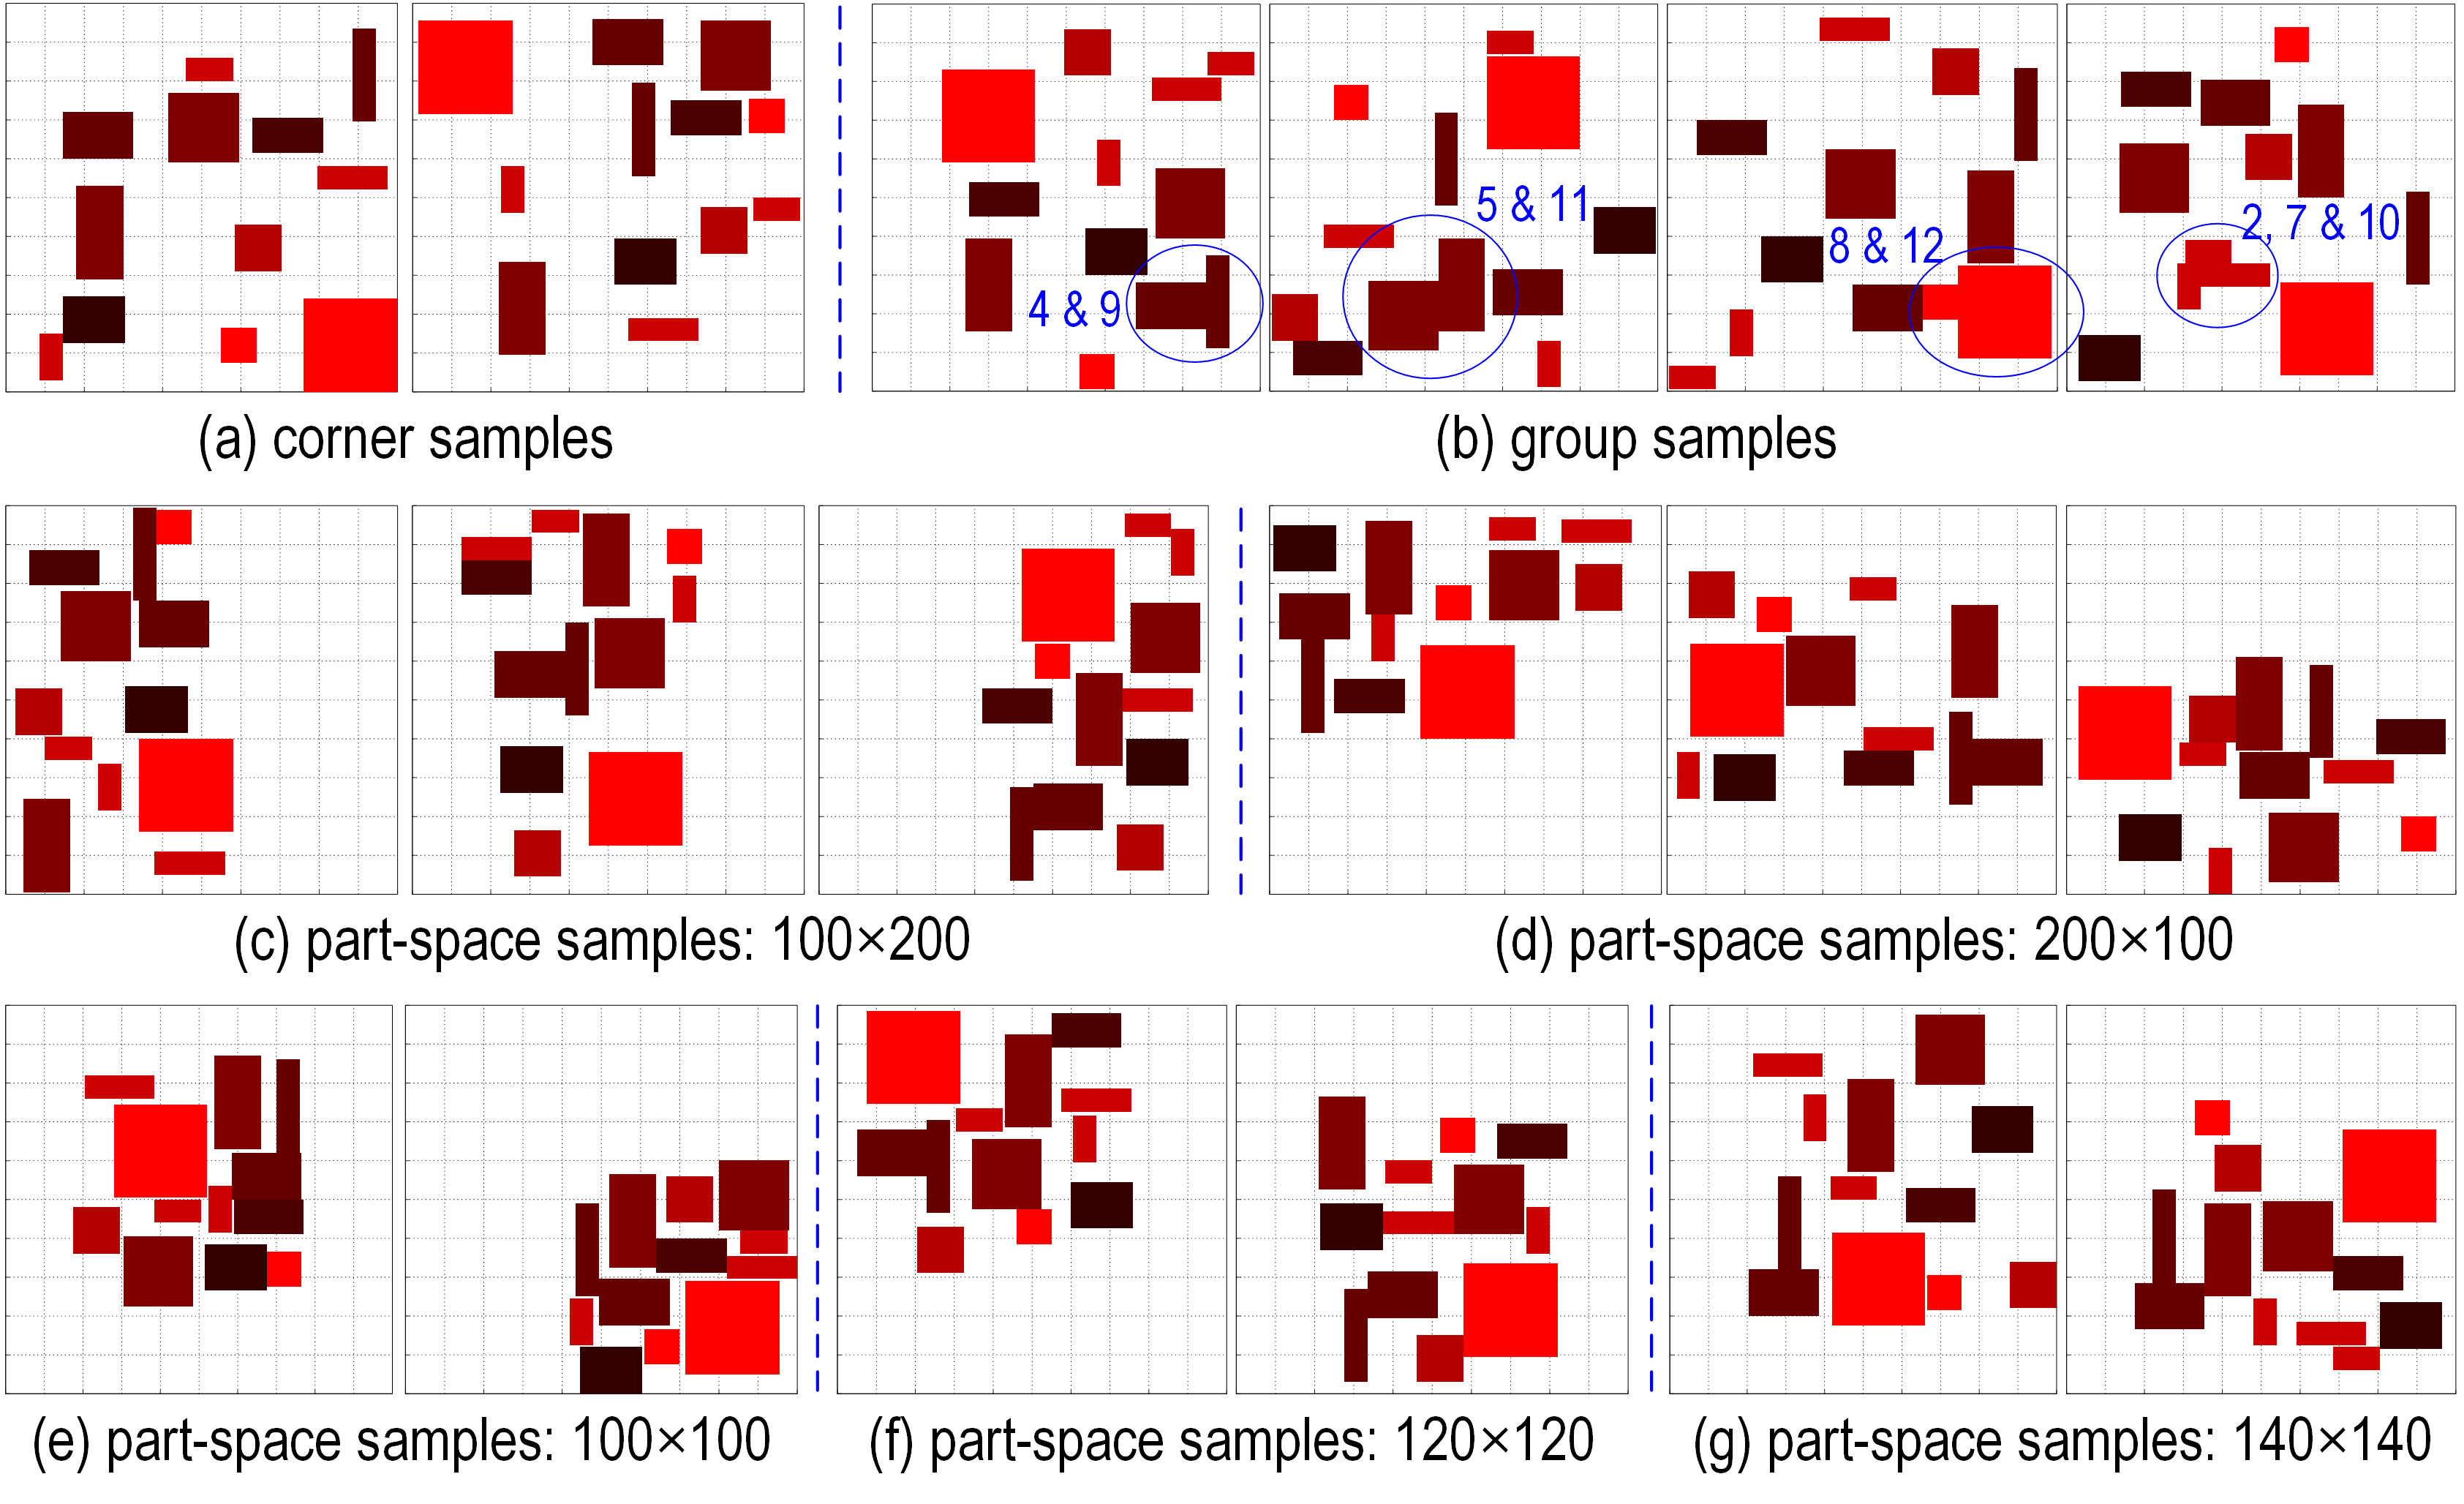
Special Samples
Special samples are divided into seven different types from the view of positions of the largest heat source, relative positions between sources with the same power, and limited layout area, and others.
Testing Set Description
40000 testing samples are divided into nine testing sets, which tries to provide thorough evaluation of prediction performance of surrogate model.
| Testing Set | Number of samples | Type |
|---|---|---|
| 1 | 10000 | Sequence layout samples |
| 2 | 10000 | Gibbs layout samples |
| 3 | 1000 | Corner samples |
| 4 | 1000×4 | Group samples |
| 5 | 1000×6 | Part-space samples: 200×100 |
| 6 | 1000×6 | Part-space samples: 100×200 |
| 7 | 1000 | Part-space samples: 140×140 |
| 8 | 1000 | Part-space samples: 120×120 |
| 9 | 1000 | Part-space samples: 100×100 |
Data Description
The sample is saved as mat format.
- 'u':{ndarray:200,200},temperature information,ranging from 298-
- 'F':{ndarray:200,200},component information of the system,ranging from 0 to 20000
- 'xs':{ndarray: 200 , 200 },coordinate of X-axis, ranging from 0 to 0.1
- 'ys':{ndarray: 200 , 200 },coordinate of Y-axis, ranging from 0 to 0.1
Evaluation Metrics
Pixel-level metrics
Absolute Error of the Maximum Temperature (MT-AE)
MT-AE measures the absolute error of the maximum temperature between predicted temperature and real temperature
Position Absolute Error of the Maximum Temperature(MT-PAE)
MT-PAE measures the deviation between the point where the maximum temperature happens in the predicted temperature field and that in the label temperature field.
Image-level metrics
Mean absolute error(MAE)
MAE is the mean absolute error of the prediction on the whole temperature field
Maximum of absolute error(Max-AE)
Max AE is the maximum absolute error of the prediction on the temperature field
Mean absolute error over Dirichlet boundary(BMAE_D)
BMAE_D computes the mean absolute error over area of Dirichlet boundary
Mean absolute error over Neumann boundary(BMAE_N)
BMAE_N computes the mean absolute error over area of Neumann boundary
Component-constrained mean absolute error(CMAE)
CMAE computes the mean value of the absolute error over the heat-source component.
Gradient-based mean absolute error(G-MAE)
G-MAE computes the mean absolute error of the gradient distribution based on the central difference.
Laplace-based mean absolute error(Lap-MAE)
Lap-MAE computes the absolute error between the Laplace operator over the whole system.
Batch-level metrics
Spearman rank-order correlation coefficient of the maximum temperature value
Spearman rank-order correlation coefficient of the maximum temperature value computes the correlation ($ -1 \leq \rho_{MT} \leq 1 $) of the sorts of the maximum temperature value of different layout samples between predicted temperature fields and real ones.